Pass the Uber Data Scientist Interview- Do you have what it takes?
If you're a data scientist, you want to work at a company that has interesting data — Uber definitely fits the bill!

If you're a data scientist, you want to work at a company that has interesting data — Uber definitely fits the bill! The ride-hailing company boasts 100+ million users in 785 locations and a multi-billion dollar marketing budget. Your analysis can impact decision-making on a massive scale, considering the 14m rides completed per day and $50b in gross bookings that Uber boasts. In other words: Uber is a data scientist's dream.
According to some accounts, Uber's notoriously toxic work environment is improving since the departure of co-founder and previous CEO Travis Kalanick and the arrival of its current CEO Dara Khosrowshahi.
So what does the job interview look like for a data scientist or analyst? We talked to a recent interviewee for Uber's marketing team to find out what the assessment looks like. Do you think you'd be able to pass?
This article will be broken down into the following sections:
- Resume checklist
- The format
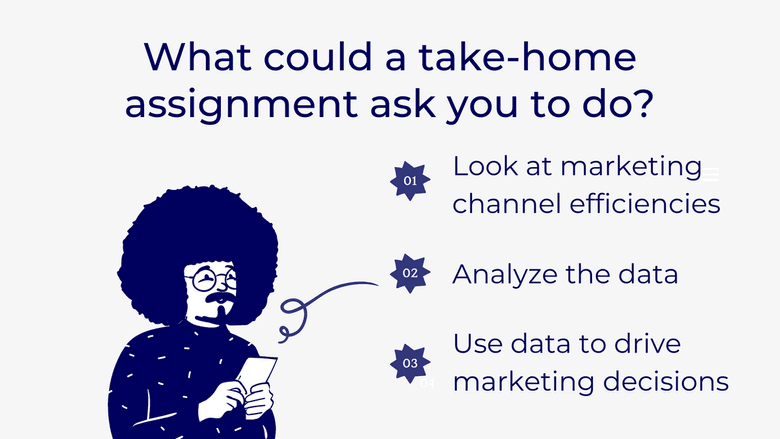
- Part 1: marketing channel efficiencies
- Part 2: data analysis
- Part 3: using data to drive marketing decisions
- How would you do and final tips
- What's the job like?
- How performance reviews and refreshers work
Resume Checklist
Your resume is the first step to getting you in the door. Here's a brief checklist so you hit the most important points:
- Make sure your resume is condensed into 1-page
- Include education, work experience, projects, and technical skills
- Use keywords from the job description when possible (without making it sound overly generic)
- Is it quantitative? Use data points to show what you've done and the impact you've had
- Do not simply include a laundry list of tools and languages. Some notable mentions from Uber's stack are Vertica, Hive, and Presto, Python, R markdown. It can also be helpful for your recruiter to indicate how experienced you are with each tool and language.
👉 Read next: How far back should your resume go? Strategies for every career stage and Which resume outline should you use?
The Format
👉 You'll first have a recruiter phone screen and technical phone screen. Read Navigating the Uber Interview: Questions & Process to learn more about these rounds.
After a few rounds of screening, interviewees will be asked to complete an assessment. It's designed to assess the candidates' technical skills as a data scientist or data analyst. In our candidate's case, it was a take-home assignment, and they were given about a week to put it together.
The assessment works by posing a fictional scenario reflective of the type of work you'd do. Uber provides fictional or anonymized data for you to work with, and expects that you'll use the assignment to showcase your skills and abilities.
We suspect the assessment will vary over time, or even change depending on team and location (even within the United States). So take this exercise as a general example of what to expect — this will likely not be the exact problem you encounter.
Although the structure will be different, the technical skills you demonstrate in this exercise will be applicable to other tech giants.
Part 1: Marketing Channel Efficiencies
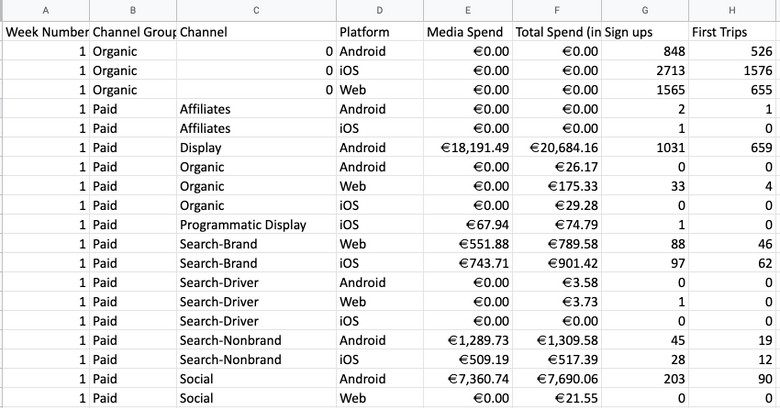
The candidate is provided with a data set from the fictional city of "Qarth" (hello Game of Thrones fans!), showing sign-up and trip data of riders. You're told the average Lifetime Value (LTV) of a rider is $45, and asked the following:
- Are we spending the right amount on paid marketing in this city?
- Is the budget allocation across the sub-channels appropriate based on this data?
- Propose a plan that will be put in place over the next 4 weeks, to help maximize marketing spend efficiency.
The Output: Please put together a max of 8 slides and be prepared to speak to them. Make sure to explain any assumptions you make.
Insider Tips
- This is a pretty straightforward exploratory data task — you could even do it in Excel without cracking open a Jupyter Notebook.
- They're looking for a basic understanding of how to analyze data, and this would be a great place to demonstrate any domain experience you have working with marketing performance data.
- The key is segmenting cost per first trip by channel, channel group, and platform, then seeing how performance is trending over time.
Part 2: Data Analysis
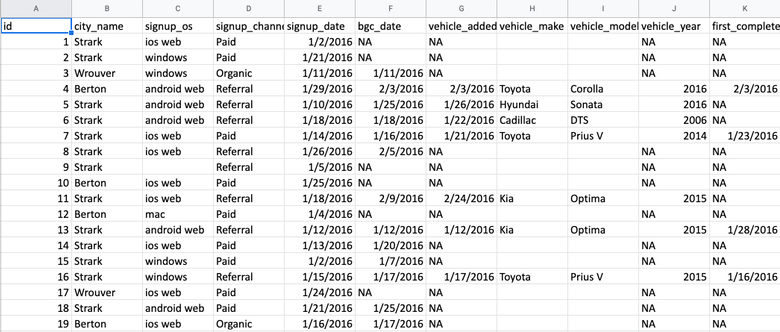
In the second fictional scenario, Uber's Driver team (i.e. the supply side of the business) is interested in predicting which driver signups are most likely to start driving. They provide a sample dataset of a cohort of driver signups from January 2015. It includes background information gathered about the driver and their car.
The task is to identify what factors are best at predicting driver activation, so you can make suggestions on how to operationalize these insights and improve Uber's business.
You're expected to follow this process:
- Perform any cleaning, exploratory data analysis and/or data visualization, and answer "what fraction of driver signups took a first trip?"
- Build a predictive model to help Uber determine if a driver signup will start driving. Discuss your approach and include key performance indicators.
- Briefly discuss how Uber might leverage the insights gained in your model to generate more first trips by drivers.
The Output: Please put together a max of 8 slides and be prepared to speak to them. Make sure to explain any assumptions you make.
Insider Tips
- Though they don't say, this is a classification problem, and they're expecting you to recognize that, as well as have an opinion on what is the right model to use — Logistic regression, Naive Bayes, Random Forests, etc.
- Your decision here should be made based on the predictive performance of the model, with an eye to avoiding over/underfitting the data.
- Pay particular attention to data cleaning — how do you handle scenarios where key attributes of a driver are missing?
Part 3: Using Data to Drive Marketing Decisions
In this final section, they're looking for a big picture view of how the marketing team should use data to optimize decision-making. They're looking for the following information from you:
- Provide a recommendation on monthly scorecard metrics that you believe we should review as a marketing team to measure performance.
- Uber has been making good progress on understanding incrementality from marketing campaigns. Please provide insights on how to measure incremental lift across channels.
- Provide options for segmenting Uber's customer base. Provide 3 different segmentation approaches, explain their dimensions/attributes, and what they would be most useful for?
The Output: Please put together a max of 10 slides and be prepared to speak to them. Make sure to explain any assumptions you make.
Insider Tips
- The key question is on incrementality — this is a very sore issue for Uber after they sued their own ad agency for $40m when they discovered essentially no uplift from the activity (at odds with the reports they were getting from the agency).
- Since it's a sensitive subject, don't be the first to bring it up. However, make sure you know all the technical aspects and can explain their importance.
How Would You Do?
Depending on your data science background, this could be trivial, or you might have no idea where to start. But now you know what to expect!
If you read this and felt confident, it's worth applying! If you were out of your depth, now you know what you need to learn.
Some Final Tips...
Data Analyst vs Data Scientist
This example was more applicable to data analyst than data scientist roles. Why?
- It could be done without Python (you can do regression analysis in Excel!) or SQL
- It doesn't need to be done in real-time
- You don't need to be a software engineer, know any computer science, or use machine learning to do this task.
Cultural Understanding
The difficulty for even senior data scientists in completing these assessments will be in getting the culture right. There will be specific topics that are extremely meaningful to the hiring manager or even recruiter, who in this case has probably been told "find me someone who understands attribution and incrementality" after the lawsuit debacle.
It's looking out for these verbal or non-verbal queues in the interview process, and doing your own research, that can give you the edge here.
What Is the Job Like?
The work offers a lot of opportunities for impact
Uber is known for having a developed and advanced data science department, so you should expect to be solving complex problems with immediate impact. Data scientists explain that there are a lot of ways to apply your knowledge at Uber with its extensive worldwide and markets, as well as its deep talent pool.
Data scientists at Uber overwhelmingly report that they enjoy the work. You can expect to have a lot of ownership over your area of work and tons of opportunities for impact. An employee explained on Blind:
"I work on a relatively large team. ~15 data scientists and have a ton of ownership. I'm able to pick and choose interesting projects within the scope of our team/OKRs and run with it. I can't speak for other teams, but there are definitely places here that give you a lot of responsibility."
Work-life balance has improved tremendously
Uber has a good work-life balance nowadays (though it's not a rest and vest culture either) — you can find plenty of companies with better WLB and plenty with worse WLB. An Uber employee reported their experience on Blind:
"I consider Uber to be “normal” for a tech company: on-call rotations, some nights/weekends around deadlines/launches, but otherwise typically 9-5/10-6."
Work-life balance at Uber is also heavily dependent on your team (as it is at most companies) with some offering a WLB as good as Google with others as toxic as Facebook.
Uber was known for having a pretty bad WLB in its earlier days — which is not uncommon for a company experiencing growing pains. A reviewer on Blind described the shift:
"Employees were leaving Uber in 2017 in large numbers because of all the scandals. Management cut back on PIPs, unreasonable expectations, ridiculous stack ranking policies, because the departures jeopardized the business. WLB got a lot better."
The pay could be better
Despite the positives, Uber is known for offering lower pay than similar companies.
Let's take a look at the pay breakdown for a data scientist at Uber in the San Francisco Bay Area (by level):
- L3: $120k base and $27k equity
- L4: $145k base and $68k equity
- L5a: $184k base and $123k equity
- L5b: $203k base and $169k equity
To take a look at the average compensation for different cities, check out our offer review page.
Performance reviews & refreshers
Performance reviews at Uber happen twice per year in June and December, and though refreshers aren't guaranteed, they're given to most.
👉 To learn more about Uber's performance reviews and refreshers, read Navigating the Uber Interview: Questions & Process.
The information provided herein is for general informational purposes only and is not intended to provide tax, legal, or investment advice and should not be construed as an offer to sell, a solicitation of an offer to buy, or a recommendation of any security by Candor, its employees and affiliates, or any third-party. Any expressions of opinion or assumptions are for illustrative purposes only and are subject to change without notice. Past performance is not a guarantee of future results and the opinions presented herein should not be viewed as an indicator of future performance. Investing in securities involves risk. Loss of principal is possible.
Third-party data has been obtained from sources we believe to be reliable; however, its accuracy, completeness, or reliability cannot be guaranteed. Candor does not receive compensation to promote or discuss any particular Company; however, Candor, its employees and affiliates, and/or its clients may hold positions in securities of the Companies discussed.