Data Scientist, Analytics Job Landscape
The full download on one of the most popular roles in tech - Data Scientist, Analytics.

With special thanks to Sean Prentis and Emma Nathan for contributing to the article.
In today’s job environment, the Data Scientist title is a loaded term. Candidates who want to land the phone screen need a more nuanced understanding of what the “Data Scientist” roles are actually looking for and should weave that knowledge into their resume.
In today’s article, I am going to share a deeper view into the different types of Data Scientist Analytics roles that exist in today’s job environment. By sharing this, I hope to help inform future candidates of (1) how they should be framing their existing experiences to stand out to recruiters and (2) what kind of projects they should be adding to their project portfolio based on the role they are targeting.
We are not focusing on Data Scientist CORE and Algorithms roles. These roles are significantly more technical, as they require software engineering skills and are further away from the core business.
The Different Types of Data Scientist Analytics Roles
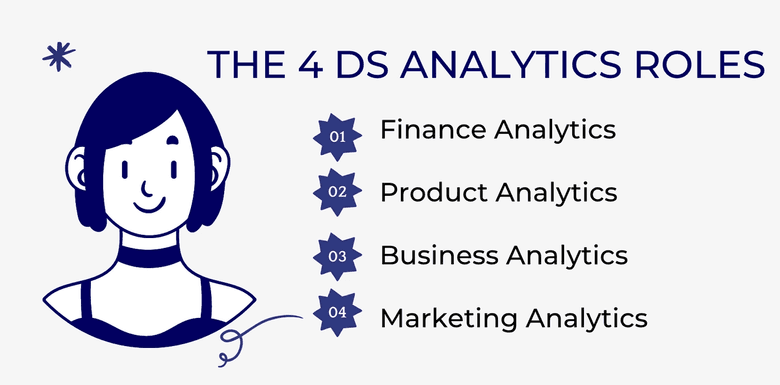
While there are many “Data Scientist” roles out there, there’s actually a more granular view of the different types of Data Scientist:
- Data Scientist, Finance Analytics
- Data Scientist, Product Analytics
- Data Scientist, Business Analytics
- Data Scientist, Marketing Analytics
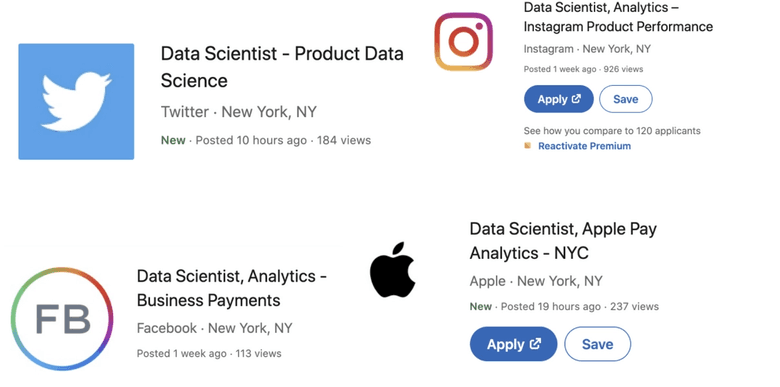
Example Job Postings
Data Scientist, Business Analytics (AKA Senior Data Analyst, Analytics Lead)

Data Scientist, Finance Analytics

Data Scientist, Product Analytics
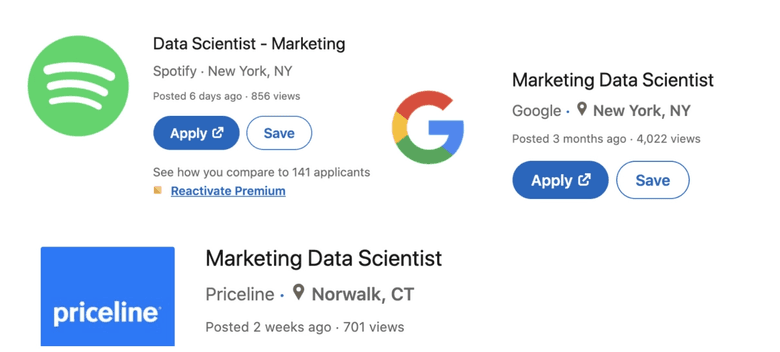
Data Scientist, Marketing Analytics
If the role doesn’t mention the type in the posting, they might mention it in the job description. Alternatively, you could be interviewing for a generalist role where you will be placed into a team after the hiring process.
In today’s article, we will be diving into Finance, Product and Business Analytics. Please feel free to skip to a section that is most relevant to you.
Data Scientist, Product Analytics
Data Scientists within the Product organization partner with the PM to help them improve and grow the product. The PMs set the goals to prioritize, while the Data Scientist helps the team define metrics and develop dashboards to track progress against goals. In addition, once the goals and metric have been clearly established, the Data Scientist independently identifies opportunities to help achieve those goals through analysis or more technical projects.
What's Important for this Role?
We believe the most important characteristic of being a Data Scientist, Product Analytics is having Product Sense. Product Data Scientists are expected to take strong initiative and drive a lot of ideas and projects to completion. Strong Product sense will ultimately help the Data Scientist identify and prioritize the most impactful opportunities for the Product.
Key Responsibilities Include...
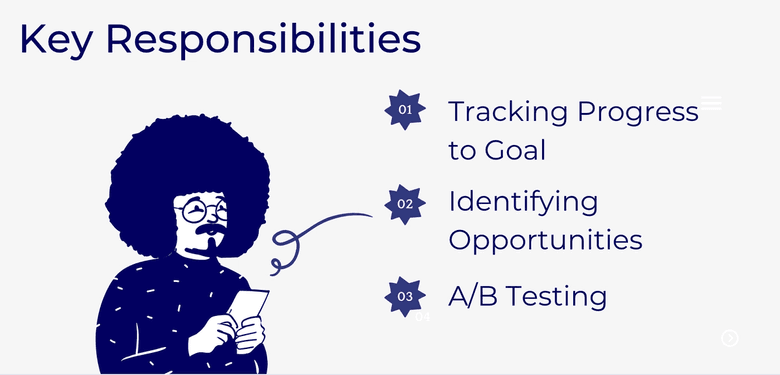
1. Tracking Progress to Goal
Defining a metric, developing an ETL and dashboarding are often a large part of the Data Scientist’s job to help the organization track and measure progress against KPIs. In fact, goals could be set as often as quarterly or bi-annually, and the Data Scientist will spend their time developing the reporting and insights necessary to monitor trends.
Here's an example of how this might look...
Goal: Company X has noticed that YoY Retention has decreased by 5% and has set a goal to increase customer retention by 10% this upcoming quarter.
Metric: Your job will be to define a metric to measure Customer Retention.
Additional Considerations & Analysis:
- How long does a customer need to be active for to be considered retained?
- How do you account for edge cases (e.g. user cancels by then resumes subscription 7 days after, are we counting users who rejoin within 7 days as having never churned?)
Query + ETL: Define a query to track the key metric and develop an ETL to generate the data on a recurring basis.
Dashboarding: Create a dashboard to help track this metric over time.
2. Identifying Opportunities to Meet Goals
The more fun part of the Data Scientist’s job is coming up with projects to help influence the key metrics. By speaking with Cross-functional stakeholders such as Designers and PMs, you may find some hints where there could be some low hanging fruit.
One example of this for product analytics roles: product insights. This requires analyzing a specific product area, customer segment or customer journey that could be improved. Below, you'll find two examples of how this might look.
3. A/B Testing
We want to release a feature that we believe will positively move some metric and therefore some upstream goal. There are really three key phases to this type of work: (a) Identifying key hypotheses to test (b) Testing the hypothesis (c) Analyzing the results
a) Identifying Key Hypotheses and therefore Experiments to pursue
Acquiring Product Sense is the most important part of identifying valuable hypotheses. Product sense is defined as a trained intuition for how the product works and growth areas. A couple of high-level examples of Product Sense for Facebook could be understanding that they have:
- Network effects: The more users Facebook has, the more social value the product provides
- Positive user-feedback loops: The more data a user gives to Facebook, the more valuable the platform becomes to the user and the more likely they are to come back (e.g. if you share an IG post, it’s likely you’ll come back to see the likes/comments you received)
b) Testing the hypothesis
Executing on the A/B Test is one of the more tactical parts of the job. Two key things you will need to be able to do are
- Identify key goals/metrics to track for the experiment
- Design the experiment, while keeping in mind how to design around key business obstacles (e.g. network effects, seasonality)
c) Analyzing the results
The results of an experiment goes beyond just reading the performance of your top-line metrics. While having a meaningful magnitude change, narrow confidence intervals and statistical significance are desired, not all experiments will yield good results. In these cases, the Data Scientist should be able to diagnose the root cause for the results and recommend next steps.
That can range from identifying a bug in the experiment setup and re-running the experiment again, or identifying some nugget insights in the initially crappy results by slicing the results on key business dimensions (e.g. in FB, our experiment performed bad overall but did exceedingly well for users ages 40-55)
Data Scientist, Business Analytics
The role of Data Scientist, Business Analytics is to pull ad-hoc insights and reporting for Business Stakeholders, to grow client accounts and improve relationships. Other titles given to this role are Data Analyst and Analytics Lead.
Your stakeholders are generally generally staffed on externally-facing teams (i.e. Sales, Account Strategy/Management/Marketing). You may be assigned to a “POD” of multiple Account Managers or Sales folks who are all focused on a book of business, vertical or product line depending on how your team/org is structured.
The volume of work will be highly correlated with the cycle of the business and the inbound work that your stakeholders are facing. You will be often crowned the most technical stakeholder in client-conversations by being trained on the product’s mechanics, levers and data.
What's Important for this Role?
We believe the most important characteristic for a Data Scientist, Business Analytics is having a collaborative spirit. Leveraging strong communication skills with both your internal stakeholders and clients to drive alignment is critical to ensuring your insights and reporting drive the intended business impact.
Key Responsibilities Include...
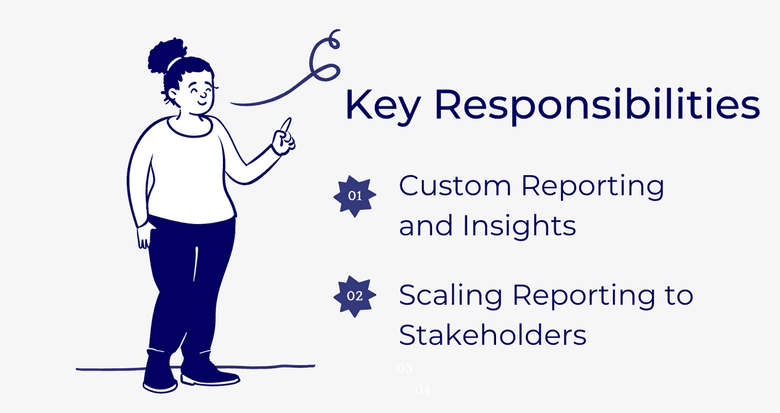
1. Custom Reporting and Insights
To help grow and support your stakeholder’s clients, you are expected to ingest 3rd party datasets and create custom metrics to ultimately develop insights and reporting. These reports will then be used to (a) track performance with your stakeholders on a recurring basis and (b) guide decisions on activating key product levers to enhance performance.
Here's an example of how this might look...
An eCommerce client has a segment of users who joined their business last year through a tent-pole event, and they would like to see how this audience has performed in a video advertising campaign. The client has sub-segments for this audience and would like to see reporting broken out by the sub-segments. In addition when computing ROAS, the client would like to exclude any sales utilizing a specific promotional code that discounted the purchase. The reporting identifies that a sub-segment is performing incredibly well on the custom ROAS metric, and the client decides to shift their advertising budget to that specific segment.
2. Scaling Reporting and Insights to Stakeholders
Multiple clients often ask for the same reporting and insights. To reduce de-duplication of effort across several Scientists, it may make sense to develop a dashboard that can support multiple clients, therefore reducing deduplication of work across teams. In addition, we may find that some insights are working exceeding well and we want to consider making these reports more broadly available to the team to maximize impact.
In moments like these, scaling reporting and insights is the main role of the Data Scientist, which can be a fairly technical process, especially if the reporting generation process requires both significant computation and space requirements. In this case, the Scientist may be expected to generate new ETLs to support the new Dashboard. Across the organization, the decision around which reports and insights to scale is often the toughest question and will require a prioritization framework that the team agrees upon.
Once this dashboard is built, the scientist may also be responsible for training and evangelizing the dashboard to internal stakeholders. This is often accomplished through live demos, which may be recorded so that folks can watch them later. In addition, the Scientist may hold office hours to answer QA, receive feedback for future iterations and even create a slack channel for more straightforward questions.
Data Scientist, Finance Analytics
In the world of Finance Analytics, rigor and accuracy are the top priority because reports are used to close the books and report to the SEC. The role of the Data Scientist, Finance Analytics is to become the domain expert on payments data and infrastructure, and ensure the integrity of the reporting.
This is accomplished by understanding the needs of Finance stakeholders and translating that to updates in the data architecture and downstream reporting. These stakeholders are often Accountants, Auditors, FP&A and Payments Product Managers and can be working on topics related Accounting, Tax and Treasury. The Data Scientist will also work closely with Data Engineering to ensure that the architecture is designed appropriately.
What's Important for this Role?
We believe the most important characteristic to becoming a Data Scientist, Finance Analytics is having a passion for investigating the details. In Finance Analytics, numbers need to align to the penny and the tolerance for deviations is very low. If a record does not add up correctly, the Scientist will need to enjoy searching why a discrepancy occurred, developing solutions to fix it, and propagating processes to preempt those issues in the future.
Key Responsibilities Include...
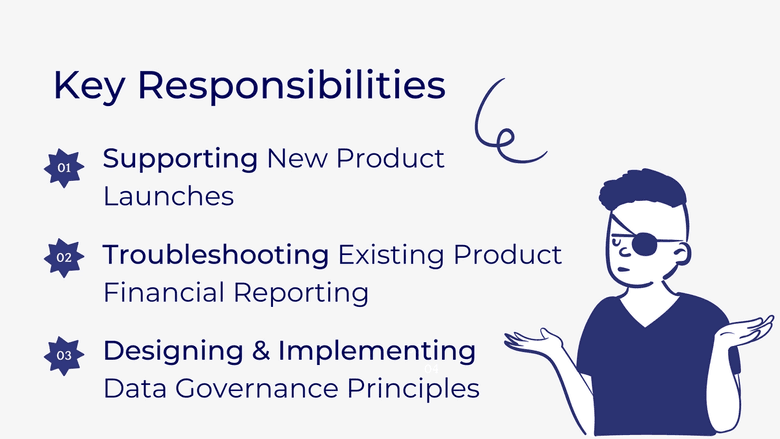
1. Supporting New Product Launches
When a new product launches in the org, the Finance Analytics team will often ask: how would you report on this product for our SCC filings? What data does accounting and finance need to generate their reports? This would help them understand what new metrics to develop to report on, and what updates or new data architecture needs to be designed to support the product. The updates can take the shape of implementing new event tracking, creating new ETLs and/or schemas, and updating business logic in existing ETLs.
2. Troubleshooting Existing Product Financial Reporting
It's important to understand how different product components aggregate into overall revenue reporting. If issues arise, the Scientist is expected to ensure that revenue reporting at a specific grain of data (or cut of data) matches the aggregated total recorded. The Scientist is expected to understand the source of truth tables designed by the Data Engineering team, and utilize his/her business context to investigate discrepancies in reporting. Diagnosing the issue may mean reviewing several ETLs, speaking to the Data Engineers and SWE engineers who were responsible for event tracking and designing the feature, and exploring the data thoroughly.
3. Designing and Implementing Data Governance Principles
The scientist will leverage his/her experience to create processes in-place to pre-empt financial reporting discrepancies in the future. This can translate to having the proper code-reviews and validation steps before the source of the truth table is deployed. Often the Scientist will be expected to collaborate very closely with the Data Engineering team to come up with the right processes. Ultimately these practices will help elevate the quality of work an entire community of Analysts, Scientists and Engineers produce.
Olarn is a Data Scientist at Lyft working on Micromobility, follow him on LinkedIn
The information provided herein is for general informational purposes only and is not intended to provide tax, legal, or investment advice and should not be construed as an offer to sell, a solicitation of an offer to buy, or a recommendation of any security by Candor, its employees and affiliates, or any third-party. Any expressions of opinion or assumptions are for illustrative purposes only and are subject to change without notice. Past performance is not a guarantee of future results and the opinions presented herein should not be viewed as an indicator of future performance. Investing in securities involves risk. Loss of principal is possible.
Third-party data has been obtained from sources we believe to be reliable; however, its accuracy, completeness, or reliability cannot be guaranteed. Candor does not receive compensation to promote or discuss any particular Company; however, Candor, its employees and affiliates, and/or its clients may hold positions in securities of the Companies discussed.