Brian Xu: Finding the Stories in the Data
Want to be a data scientist at LinkedIn? Here's what the role is really like.

As a data scientist at LinkedIn, Brian Xu decodes the meaning of data in order to learn more about the economy.
Xu works on the LinkedIn Economic Graph team that focuses on creating a “digital representation of the global economy.” They use LinkedIn account data to gain insight into the work industry and help companies, workers and policymakers navigate change.
Particularly now, Xu says people are looking for content surrounding change in the global economy to understand the impacts of different events, like the COVID-19 pandemic.
“I'm looking at stories primarily on the economy. That’s something that people are really interested in due to the pandemic and due to the economy formally being bad. The types of stories we look at are hiring, so how are countries and cities hiring? What is the rate of hiring now compared to last year, for example, which gives an indication of how bad did it get during the pandemic and how are we recovering?”
For example, in the sixth month of the pandemic, the team published one article talking about the state of the global economy. Based on LinkedIn hiring data, they concluded that the global economy was slowly beginning to recover after months of freefall.
To do this, the LinkedIn Economic Graph turns to their own data, research and workforce reports, which come from analyzing the 700 million+ users on the website. Since March, the team has released stories analyzing what the economy looks like in context of the pandemic
Using the data, the team can also look at related topics, like workforce migration, by analyzing their user locations. In the time of COVID-19, Xu said there is a trend of people moving out of large cities in favor of working elsewhere. He said a lot of this could be due to the pandemic muting the attractive features of cities, such as booming social scenes.
With so many users, Xu said it’s possible to learn a lot.
“We basically try to see what kind of data we have, and then what kind of metrics do we come up with that actually reflect what is happening in the real world.”
Xu said LinkedIn data only works as a sample of what’s happening in the real world, but they also compare it to national data. For example, he said they often compare their metrics with data from the Census or Bureau of Labor Statistics in order to validate the general trend.
From there, Xu said they are able to dig a little further to look at specific trends and tell more granular stories.

Xu has been at LinkedIn for just over four years, however, he didn’t start off in his current role. Instead, he said he started at the company as part of a rotational sales program, but quickly became fascinated with LinkedIn data.
His transition to data science came out of his dedication to following his interests. Xu said he had some coding experience, but upon realizing his fascination, he started to learn more. He also began helping with some data projects on other LinkedIn teams outside of his daytime responsibilities. Eventually, one of the teams brought him on to work in a data science capacity. Xu has held a data science position at the company for about three years now.
Xu typically starts his day with the five-second commute from his bed to desk, which is a little shorter than usual -- he works remotely due to the COVID-19 pandemic.
The specifics of Xu’s day-to-day look different, depending on what his team requests or what's happening in the world more broadly. For example, at times he may fulfill requests from internal LinkedIn teams, or sometimes he addresses requests from reporters outside of LinkedIn who are looking to do a specific story.
Xu explained he enjoys working on this team and with data projects that include this storytelling aspect because:
“For me, a primary focus is being able to tell a story out of data and hopefully have people find that engaging. For me it’s been a good exercise, but also it fuels curiosity. Data scientists, a big portion of their job is to be curious about what certain answers might be, not necessarily what someone wants them to be. For me, it's been awesome, just being able to look at the data, produce nice visuals and then communicate that to my audiences.”
In addition, Xu will sometimes do presentations or work on data infrastructure projects, which help ensure they collect high quality data.
👉 Learn more about working at LinkedIn here

Offering insight on TikTok
Xu’s fascination with data storytelling extends way beyond his day job at LinkedIn. He takes to social media platforms like TikTok and Twitter to discuss his own life, hiring in the tech industry and other national trends.
Xu started his TikTok account – @bri_xu – at the start of quarantine because, as he put it, “what else did I have going on.” He said he didn’t expect people to pay attention to him, yet he’s found plenty of success. As of December, he’s grown to have 149 thousand followers and 4.4 million likes.
“I've just had fun with it. I don't try to like force myself to do things or create content where I don't want to, but it's been fun for me so far. I've been able to produce things and then it's always nice to know that people are benefiting from it or finding it useful.”
On TikTok, Xu said he mostly posts about his own life and shares data. He also makes some content about LinkedIn and creating better profiles on the site. For example, in one post, he explained how to take a professional profile picture.
From time to time, Xu will go live on his account to interact with his followers and give LinkedIn tips. He does this in the form of a “roast.” Xu explained that TikTok users give him their LinkedIn accounts so he can project them on his computer screen then roast – or critique– them.
While Xu admitted he’s not necessarily a career coach, he does understand the general best practices and what works on LinkedIn, especially because he can see what works in the data. He wants to share what he knows.
“I work in LinkedIn. I work in data. So outside my day job, I’m basically taking that to another platform to try to help people get jobs and help people understand more about the world of data.”
👉 What's it like to work at TikTok? Find out here
Starting important discussions
Xu looks to spark conversation about national events and show people current trends by creating visual graphics out of data that he finds timely or interesting. From time to time, he shares graphics about everything from the racial makeup of Fortune 100 CEOs to prices of streaming service.
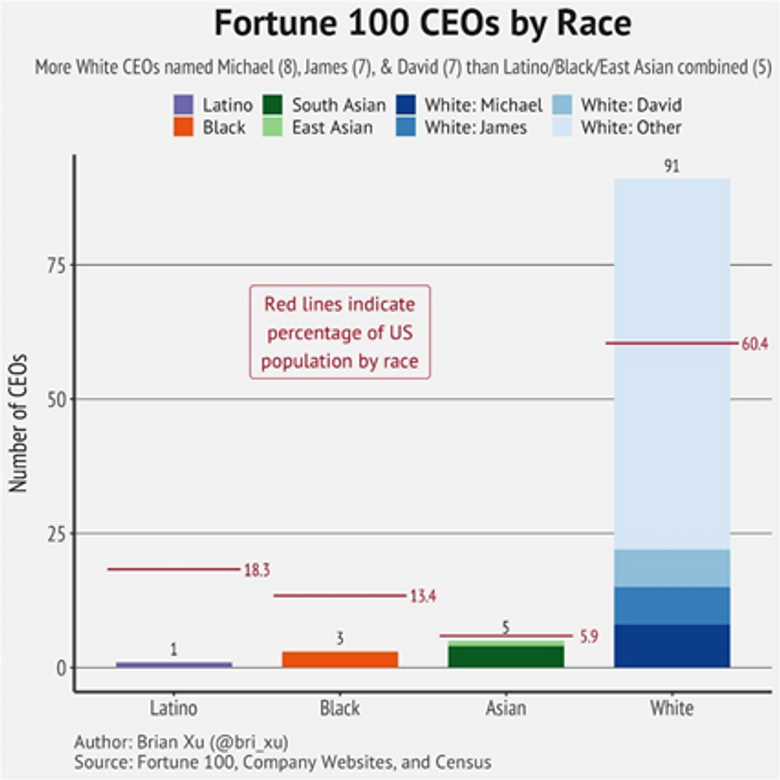
This is a graph Xu created showing the racial makeup of Fortune 100 CEOs. Xu said he made it outside of his time at LinkedIn. Graph by: Brian Xu[1]
The above graph is just one example of the types of graphics Xu creates in his down time.
Xu said telling stories and showing data in this way is important because it can untangle what is happening in the world, leaving room for deeper discussion.
"I think, right now, there’s so much discussion on what is true in terms of just people saying things and making claims. A lot of people are discussing what is true and I think it's hard to get a conversation on why that is true, or why that matters, if you can't agree on what is happening,” said Xu. “Part of my work and my TikTok is sharing things on methodology and data that I believe are happening in the real world. Then people can discuss the mechanisms of why this is happening or how should it be happening. And I think those are more important conversations."
In addition to prompting conversations, Xu said creating graphics outside of work also helps him perfect his craft, since he can gather feedback and apply it to future projects.
“It helped me improve how I message something or how I create something or how I visualized something. Some people are like ‘I really don't like the colors on this graph, and for this reason.’ So then I became more conscious of color accessibility. And some people are like ‘I don't like the labeling here -- it's confusing’ So now, next time I know how to improve that. So for me, it helps me as a data person, but also been it helps me know what kind of conversations I can produce from some of the data I’m producing”
For anyone thinking about entering data science, Xu said it’s important you start experimenting.
“Data science storytelling begins by asking yourself a data question and then producing something with them. I think getting started and making a lot of mistakes is the way to go.”
One example Xu mentioned: creating a map or visual representation of the number of chickens in the U.S. He said the going through the steps is the most important part. In order to do this, one would have to start by finding the number of chickens, and maybe the number of Chick-fil-a’s in the U.S., to compare it to. Then, one could take all the steps necessary to actually create a visualization of this data. Xu said as long as you’re trying to answer a question that piques one's interest and going through the process properly, then the practice isn’t trivial.
The practice, in fact, is what helped him get where he is now.
“I would say, honestly, just getting in there and start working on things. That's what helped me because I was very slow at the beginning I made a lot of mistakes, but eventually like once you make all the mistakes, then you get faster.”
The information provided herein is for general informational purposes only and is not intended to provide tax, legal, or investment advice and should not be construed as an offer to sell, a solicitation of an offer to buy, or a recommendation of any security by Candor, its employees and affiliates, or any third-party. Any expressions of opinion or assumptions are for illustrative purposes only and are subject to change without notice. Past performance is not a guarantee of future results and the opinions presented herein should not be viewed as an indicator of future performance. Investing in securities involves risk. Loss of principal is possible.
Third-party data has been obtained from sources we believe to be reliable; however, its accuracy, completeness, or reliability cannot be guaranteed. Candor does not receive compensation to promote or discuss any particular Company; however, Candor, its employees and affiliates, and/or its clients may hold positions in securities of the Companies discussed.