43 Tableau Interview Questions You Should Practice
Prepare for your next Tableau interview by brushing up on these questions

Originally founded in 2003 from a Stanford computer science project, Tableau has become a widely adopted data analysis and visualization tool over the years. The software company has now grown to over 5,000 employees, serving many high-profile companies including Deloitte and Walmart. Tableau’s popularity has made its tools increasingly valuable to learn for anyone interested in data science or business analytics. Many companies have even started hiring designated Tableau developers, a position that pays $81,514 per year on average, to focus mainly on creating solutions in Tableau to help improve business processes.
If you’re applying for a Tableau developer position or another role where you’ll be using the software, you’ll want to make sure you’re prepared for anything that comes up. We put together a list of 43 questions you’ll likely see in an interview and how to answer them.
General Introductory Questions
1. What is data visualization?
2. What is Tableau?
3. Why should you use Tableau?
4. How does Tableau compare to Microsoft Power BI?
How to answer them
Each of these questions may come in various forms, but your interviewer basically wants to make sure that you’re familiar with Tableau and experienced in data visualization. While they may figure that you probably know the answers to these questions, they want to make sure that you can give them a concise, detailed response. For each of these questions, have a few main points in mind, and be prepared to explain them further if necessary.
For example: Why should you use Tableau?
- Tableau is user-friendly and easy to learn even for non-technical users
- It can represent data in a more readable, visually appealing format
- It can pull data from public sources and combine it with your own proprietary data to give you new insights
- It can easily handle large amounts of data
- It can perform calculations quickly
- It can simplify processes and save time when updating periodic reports on spreadsheets
Data Visualization Questions
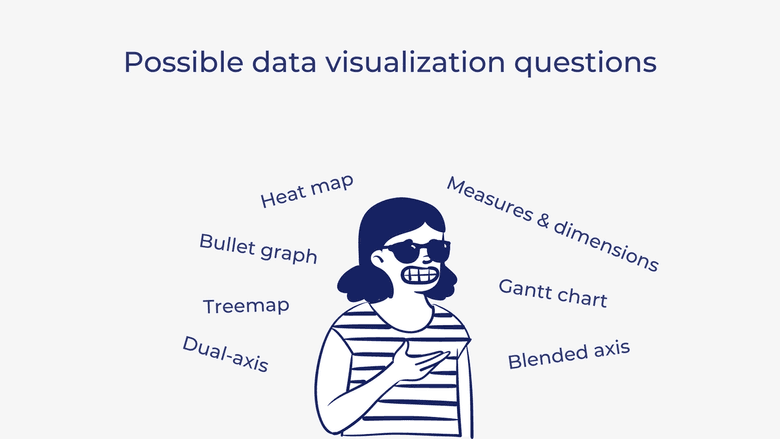
5. What’s a heat map?
6. What’s a treemap?
7. What’s a Bullet graph?
8. What’s a Gantt chart?
9. What’s dual-axis?
10. What’s a blended axis?
11. What are measures and dimensions?
How to answer them
This type of question is more applicable to general data analysis and doesn’t necessarily require any Tableau knowledge. Your interviewer will probably expect most of these concepts to be pretty familiar to you and will therefore be satisfied with a quick and simple response. We’ll touch on the answers to each of these questions, but a quick data analysis review could help prepare you for anything else that comes up in this category.
For example:
What’s a heat map?
A heat map is a graphical representation of data that represents values as colors. It helps observers to see basic patterns and trends in a dataset almost instantly.
What’s a tree map?
A tree map is a visual representation of hierarchical data that uses nested rectangles to represent categories, with the area of each rectangle corresponding to the amount of data inside of it.
What’s a Bullet graph?
A bullet graph is a variation of a bar graph that includes a distribution showing progress toward a goal behind the bar. It was originally created to replace dashboard gauges and meters.
What’s a Gantt chart?
A Gantt chart is a bar chart displays a picture of tasks scheduled over time. It’s useful for managing projects and planning out their timelines.
What’s a dual axis?
A dual axis chart creates two independent axes that allow you to plot two separate measures on the same chart.
What’s a blended axis?
A blended axis is when you have multiple measures on the same axis, as opposed to one on each for a dual axis. You’ll usually use a blended axis when you need to represent more than two measures.
What are measures and dimensions?
In data analysis, measures contain quantitative values that can be measured and aggregated. Dimensions, on the other hand, contain qualitative values like names and geography that can be used to categorize or segment your data.
Textbook Questions About Tableau Features
12. What are the different Tableau products?
13. What are the different data types in Tableau?
14. What are the different types of joins in Tableau?
15. How many maximum tables can you join in Tableau?
16. Name all of the types of filters available in Tableau?
17. What’s the order of operations for filters?
18. What are the components of a dashboard in Tableau?
19. What are the different connections you can make with your dataset?
How to answer them
If your interview asks this type of question, they want to see how familiar you are with how Tableau works. These should be pretty easy if you’ve used Tableau before, but if you’re nervous, it wouldn’t hurt to watch a quick Tableau crash course to brush up. In the meantime, we’ll go over the answers to these questions.
For example:
What are the different Tableau products?
- Tableau Desktop
- Tableau Server
- Tableau Online
- Tableau Reader
- Tableau Public
What are the different data types in Tableau?
- Boolean
- Date
- Date & time
- Geographical values
- Text/string
- Number (decimal)
- Number (whole)
What are the different types of joins in Tableau?
- Left
- Right
- Inner
- Full outer
How many maximum tables can you join in Tableau?
You can join at most 32 tables in Tableau.
Name all of the types of filters available in Tableau?
- Extract filters
- Data source filters
- Context filters
- Dimension filters
- Measure filters
- Table filters
What’s the order of operations for filters?
[Same order as above]
What are the components of a dashboard in Tableau?
- Web
- Horizontal component
- Vertical component
- Image extract
- Text
What are the different connections you can make with your dataset?
You can either connect live to the dataset or extract data onto Tableau.
In-Depth Questions About Tableau Features
20. What is data aggregation and disaggregation in Tableau?
21. What’s the rank function in Tableau?
22. What’s the difference between data blending and data joining?
23. What’s the difference between a worksheet, dashboard, story, and a workbook in Tableau?
24. What’s the difference between parameters and filters in Tableau?
25. What’s the difference between Tableau 7.0 and Tableau 8.0?
26. What’s the difference between .twb and .twbx file extensions?
27. When would you use Extract connection over Live connection?
28. What is VIZQL?
29. What’s the point of a fixed calculation?
30. Is it better to use a custom SQL join or a Tableau-made join?
How to answer them
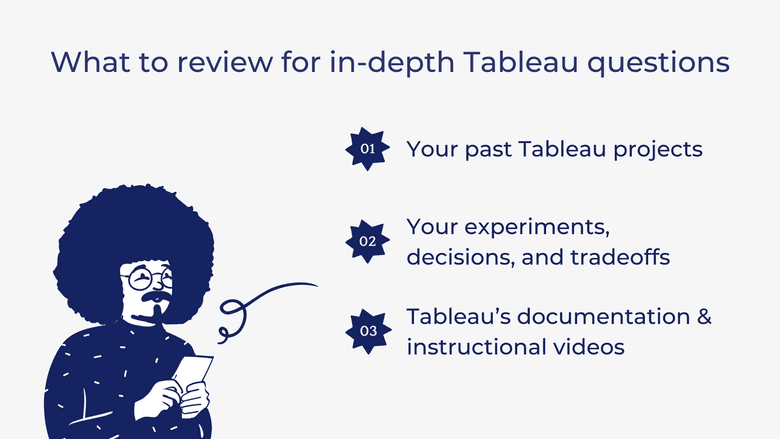
Unlike with the textbook Tableau questions, your interviewer will probably be looking for more detailed and nuanced answers to these ones. To prepare for these questions, it’s a good idea to look through some of your past Tableau projects and think about how you used each of the features. You’ll also want to think about how you experimented with the data, why you made the decisions you did, and what the tradeoffs may have been. It can also be helpful to take a look at some of Tableau’s documentation and instructional videos to review how it all works.
Since Tableau is a pretty extensive software tool, you may not have time to prepare points on every single feature. However, for every feature, you’ll want to think about a few main ideas that to discuss if an interviewer asks about it.
For example: What’s the difference between Tableau 7.0 and Tableau 8.0?
- New visualizations (treemap, bubble chart, box-and-whisker plot)
- Functionality to copy a worksheet directly from one workbook to another
- Introduced R script
How-to Questions
31. How do you create a dual axis in Tableau?
32. How do you view underlying SQL queries in Tableau?
33. How do you conduct Performance Testing in Tableau?
34. How do you create a calculated field in Tableau?
35. How do you create a context filter in Tableau?
36. How do you handle null and other special values in Tableau?
37. How do you embed a webpage in a dashboard?
38. How do you create cascading filters without using a context filter?
How to answer them
In addition to quizzing your ability to work in Tableau, an interviewer may ask you this type of question to see how good you are at explaining your process.
To prepare for a how-to question, you’ll first want to make sure that understand how to perform all of the basic tasks that may come up. Then you’ll want to make sure that you can explain each one step-by-step. Make your explanations as intuitive as possible, as if you're talking to someone who knows very little about the platform.
For example: How do you create a context filter in Tableau?
- Pull your dimension onto Columns
- Drag measure A to Rows and measure B to Rows next to A
- You’ll have SUM(A) next to SUM(B)
- Right-click on SUM(B) and choose Dual Axis
- The two axes on your chart will have two scales
- If you want the axes to be synchronized, right-click on the B axis and select Synchronize Axis
Personal Experience Questions
39. Talk me through your design and build process.
40. How do you work with the Tableau Community?
41. What are some examples of times you’ve used parameters?
42. Have you ever had a dashboard run too slow, and how did you fix it?
43. What bothers you about Tableau?
How to answer them
This type of question is meant to gauge your level of experience in using Tableau. The interviewer wants to see how you communicate and solve problems. They also want to know how extensively you used Tableau in past projects. If the role you’re applying for doesn’t seem to require a lot of hands-on experience in Tableau, don’t worry about not having much to talk about. On the other hand, if you’re trying to prove how well you know your way around the software, it’s important to represent your experience as well as possible.
You can prepare by reflecting on how you used Tableau in the past, thinking about your involvement in the Tableau Community, and thinking of any challenges you’ve encountered while using it.
For example: Have you ever had a dashboard run too slow, and how did you fix it?
If you have a lot of experience using Tableau, odds are that you’ve wanted it to run faster at some point. Tell them about the situation, touching on all of the steps you went through troubleshoot it and eventually resolve the issue. Even if you haven’t had this experience, you can tell them what you would have done in order to optimize the dashboard’s performance, like:
- Reduce the scope of data to decrease the volume
- Reduce the number of marks in the view
- Try to use integer or Boolean calculations over strings where possible
- Exclude unused fields from the visualization
- Use context filters
- Reduce the number of filters
- Remove unnecessary calculations and sheets
Preparing for the Interview
Aside from mock-interviewing, the most useful way to prepare for a Tableau interview is to play around with the software. Look through your old projects, experiment with dummy data, and practice with some Tableau Community activities. Tableau Desktop is completely free for individuals, so you can experiment with it as much as you’d like.
The information provided herein is for general informational purposes only and is not intended to provide tax, legal, or investment advice and should not be construed as an offer to sell, a solicitation of an offer to buy, or a recommendation of any security by Candor, its employees and affiliates, or any third-party. Any expressions of opinion or assumptions are for illustrative purposes only and are subject to change without notice. Past performance is not a guarantee of future results and the opinions presented herein should not be viewed as an indicator of future performance. Investing in securities involves risk. Loss of principal is possible.
Third-party data has been obtained from sources we believe to be reliable; however, its accuracy, completeness, or reliability cannot be guaranteed. Candor does not receive compensation to promote or discuss any particular Company; however, Candor, its employees and affiliates, and/or its clients may hold positions in securities of the Companies discussed.