
While there's a lot of good information on AB tests online, very few resources focus on how to prep for an interview. If you're a Product Manager or Data Scientist - this one is for you! It's critical you nail this, so let's get tactical about what resources you should use.
What Should You Expect?

Defining A/B testing
A/B testing is where you test two variants of the same thing to see which your users prefer. These tests are important to measure impact solely from the change and establish a causal relationship between actions and results. Commonly, these will be used in helping decide changes like:
Product changes
- UI design or adding new features
- Algorithm Enhancement of recommendation systems, search ranking, or ads display
Growth optimizations
- Promotions, coupons, or incentive programs
- SEO optimization
How to tackle this kind of question
A/B test interview questions will ask you to cover the full process of setting up and executing a test, which will include the following framework (use this in your answers to stay structured!):
- Design of Experiment and define methodology
- Result Measurement / Analysis
- Product Insights / Run experiment
- Launch Decisions Platform Team
Here's what they ask at FAANG:
- Teenage users are much less engaged on Facebook app after their parents join. Why is that and what would you do? (asked by Facebook)
- You have been given a $150,000 budget to spend on promoting a new product. How would you chose between the following channels - email, display ads, earned media, regular mail? (asked by Google)
- Your team suggests a new way to boost revenue by adding a new product category on your site but management is worried that might actually hurt sales and turn away existing vendors. What do you do? (asked by Amazon)
👉 Want more recent examples? Check them out here
What Is the Interviewer Looking For?

In short, you need to show that you have a strong statistical foundation and a sound understanding of the mechanics of running AB Tests with your team. Here's how that looks when you break it down.
1. Examine the question
Here's the interview question from earlier- how would we tackle it?
Your team suggests a new way to boost revenue by adding an athletic product category on Amazon.com but management is worried that might actually hurt sales and turn away existing vendors. What do you do? (asked by Amazon)
2. Form a hypothesis
We need to form a hypothesis based on this question. A good hypothesis clearly describes the relationship you want to test.
In our case, we're testing “does adding an athletic product category to the site increase revenue?” To test it properly, we need to split it into two statements:
- Null hypothesis (H0): The null hypothesis usually states that there is no change between treatment and control groups.
- Alternative hypothesis (H1): The alternative hypothesis states that there is a change between treatment and control groups. (In other words, the treatment outcome will be statistically different to the control outcome)
A good rule of thumb of making sure you do this right in your interview is to follow the PICOT framework: Population, Intervention, Comparison, Outcome, Time
According to Towards Data Science: "Notably, a hypothesis should include reference to the population under study (Amazon.com US visitors, London bank customers etc), the intervention (website layout A and B, targeted loan repayment SMS), the comparison group (what are comparing to), the outcome (what will you measure) and the time (at what point will you measure it)."
Applying it to our case:
In our case, we're testing “does adding an athletic product category to the site increase revenue?” To test it properly, we need to split it into two statements:
- Null hypothesis (H0): Adding an athletic category product page to the Amazon site will not have any change on sales in the US.
- Alternative hypothesis (H1): Adding an athletic category of produts to the Amazon site will have a statistically significant change in sales in the US
Using the PICOT framework, we can build out our hypothesis even more.
- Population: individuals who have visited the Amazon.com site
- Intervention: new product category of athletic products
- Comparison: visitors who have the original layout
- Outcome: Purchase rate
- Time: End of visit to Amazon.com
3. Build a randomization strategy
Next, we want to randomize our visitor samples. Do this so each participant has an equal chance of being randomly assigned to a Treatment/Control group. This is the only way to ensure that you can avoid confounding bias. You should also account for cluster effects and use the correct unit of randomization.
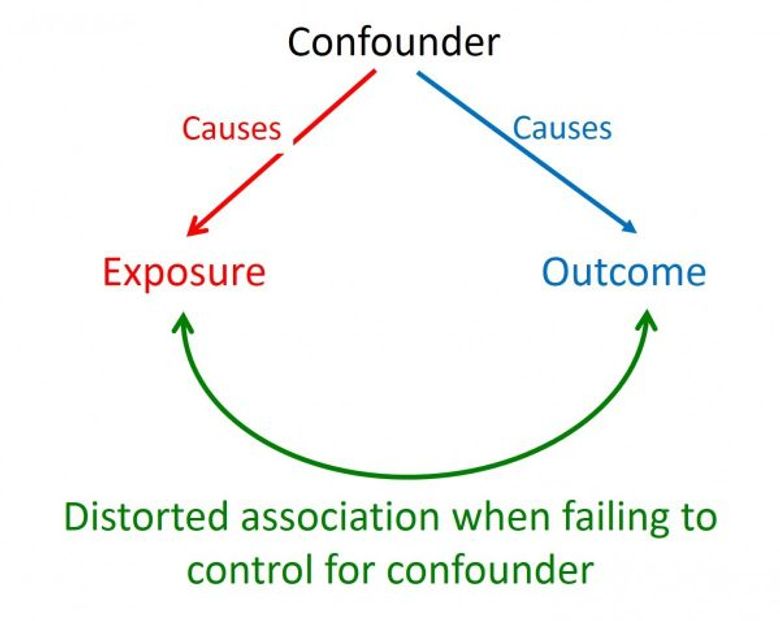
The principle of confounding; the confounder makes the exposure more likely and in some way independently modifies the outcome, making it appear that there is an association between the exposure and the outcome when there is none, or masking a true association.
A question you will be asked as a follow up in the interview is HOW you made the randomization decision. In our case, we have two options:
- Randomly assign visitors to Layout A or B homepage
- Allow visitors to opt-in to new layout tests with the athletic product category
In this case, randomly assigning ourselves is the better strategy. If we allow visitors to opt in, we might weaken our A/B test. What if more visitors sign up from a certain country or gender?
Confounding can occur even with randomization. There's a famous study of the medication Metformin, used for diabetes control, that showed Metformin helps lower cancer rates. This was later found to be untrue due to poor control of confounding effects in the study. One way to avoid that is to use propensity scores, in which potential confounders are used to build a statistical model that assigns to each person a number called their propensity score. The people with high scores are more likely to have certain confounders, and those with low scores are less likely.
4. Metrics are everything
Metrics should be set before the experiment starts to help you understand what kind of changes your experiment is causing (and differentiate what changes are significant). Ideally, you're structuring your metrics into two key categories:
- Key metrics: a few metrics you will use to judge the experiment and make business decisions.
- Monitoring metrics: this could account for
- metrics to measure negative effects
- existing metrics your org tracks (to estimate impact)
Sensitivity & Robustness
Metrics should pick up the changes you care about (sensitivity), and not pick up the changes that you do not care (robustness).
e.g. Mean is sensitive to outliers and heavily influenced by these observations. However, median is less sensitive and more robust, but if you only affect a fraction of users, even a large fraction like 20%, the median might not change.
Use A/A test to estimate the empirical variance of the metrics.
A/A tests compare people seeing the same thing to each other to check if the metric picks up the difference between the two.
A/A tests divide a group and use the same controls to compare so that the difference is driven by the underlying variability (like what operating system a user has). If you see a lot of variability in a metric in an A/A test, it might be too sensitive to use in experiment.
5. Choose a sample size
Exposure and duration
Generally, a test will be deployed to a subset of users and you will be asked how you'd decide the sample size in the interview. Generally, this is done because you don't want a negative impact on all users if the experiment is unsuccessful. Generally, these experiments involve 5% or less of the user base and are rolled out gradually.
How to decide exposure % in an interview
- What's the size of the eligible population?
- Estimate the impact on the user experience and business impact
- How hard would it be to test and debug for the engineering team?
Think about the scale of the work required by the engineering team and the scope of the change. For example- which one do you think would have bigger scope? :
Example 1: Redesign of the full layout of your web page.
- May significantly change user behavior. Needs three teams of engineers and designer help to coordinate.
Example 2: Change the button color on the landing page CTA conversion rates.
- One engineer would do this in 2 minutes.
Here are some questions the interviewer might ask about sample size/exposure:
- How long would you run your experiment?
- What is your minimum sample size?
- What will you do to balance user experience and quick learning?
- What is your roll-out plan?
Some Math You Want to Brush Up On

Statistical Significance
Significance has a precise meaning in statistics and many people without a formal statistical background misunderstand the concept. I highly recommend this UC Berkeley course on statistical inference
Type I, II errors
Or, more simply put: anytime we make a decision using statistics, there are four possible outcomes, with two representing correct decisions and two representing errors. The chances of committing these two types of errors are inversely proportional: that is, decreasing type I error rate increases type II error rate, and vice versa.

Power Analysis
Power analysis is normally conducted before the data collection. Its main purpose is to help the researcher determine the smallest sample size capable of detecting the effect of a given test (at the desired level of significance).
This is an excellent resource to read up by Matthew Conlen or if you prefer video
Minimum detectable effects (MDEs)
“What is the minimum effect that I would need to see for the intervention to be worthwhile?”. If the return on investment (ROI) of a proposed intervention is negative or very negligible, then we don’t need to be able to precisely measure such a small value to make a decision.
Example 1: Redesign of the full layout of your web page. Needs three teams of engineers and designer help to coordinate. Cost - $50K
In example 1 we would only care about being able to detect effects greater than $50,000. For arguments sake, let’s say that $50,000 corresponds to a 7% point uptick in conversion rate. We then set our MDE to 7 points and our effect size to 7 points for our calculations.
The information provided herein is for general informational purposes only and is not intended to provide tax, legal, or investment advice and should not be construed as an offer to sell, a solicitation of an offer to buy, or a recommendation of any security by Candor, its employees and affiliates, or any third-party. Any expressions of opinion or assumptions are for illustrative purposes only and are subject to change without notice. Past performance is not a guarantee of future results and the opinions presented herein should not be viewed as an indicator of future performance. Investing in securities involves risk. Loss of principal is possible.
Third-party data has been obtained from sources we believe to be reliable; however, its accuracy, completeness, or reliability cannot be guaranteed. Candor does not receive compensation to promote or discuss any particular Company; however, Candor, its employees and affiliates, and/or its clients may hold positions in securities of the Companies discussed.